The Art of Sequence Alignment
Articles —> The Art of Sequence Alignment
Sequence alignment algorithms attempt to find similarity in two or more DNA or Protein sequences, and are fundamental in the biological sciences. While implementing one of these algorithms, I was struck by the similarity of the mathematical result to that of an image - both being a 2-dimensional matrix of numbers. As a photographer and artist, this led to the following question: can I create interesting images - art - from a sequence alignment? A Dot Plot could be considered the answer to this question, yet dot plots are typically binary, and while they result in interesting patterns I was looking for something a bit less symmetrical and a lot more colorful.
There are several alignment algorithms which are used extensively, one of the more prominent is a dynamic programming algorithm named after its founders - Smith Waterman, used to align two sequences. At its core, the Smith-Waterman algorithm builds a matrix - or table - of scores. Each sequence is made up of 'residues' - similar to letters in a word. The column names of this matrix represent residues in the first sequence, the row names the residues in the second sequence, and each cell value represents a score of the nucleotide (or amino acid) paired with that of the opposite sequence (see table 1 below). The score of each cell is dependent upon two variables: the score of its adjacent cells and that of the pair itself.
To assign the scores, the matrix is first initialized then built from the top left down to the bottom right, the score of the current cell is dependent upon that of the upper cell (gap), left cell (gap), and upper left cell (match or mismatch) - the highest value of:
- The left cell plus a gap score (typically negative)
- The upper cell plus a gap score
- The upper left cell plus a score (this could be a basic match/misatch score, or an alignment matrix scrore, such as a BLOSUM or PAM matrix)
As an example, consider the two sequences:
GACAAT
GGCAT
To keep things simple, we'll use a basic scoring scheme:
- Match: 2
- Mismatch: -3
- Gap: -3
Step 1: Initialize the Matrix
| G | A | C | A | A | T | |
| G | ||||||
| G | ||||||
| C | ||||||
| A | ||||||
| T |
Table 1: Two sequences positions in a sequence alignment matrix.
Step 2: Fill in the Matrix
| Upper Left | Left | Top |
| G | A | C | A | A | T | |
| G | 2 | -1 | -3 | -3 | -3 | -3 |
| G | 2 | -1 | -4 | -6 | -6 | -6 |
| C | -1 | -1 | 1 | -2 | -5 | -8 |
| A | -3 | 1 | -4 | 3 | 0 | -3 |
| T | -3 | -2 | -2 | 0 | 0 | 2 |
Table 2: Resulting scores from filling in the matrix based upon match, mismatch, and gap scores.
Step 3: Trace Back
In this step, the highest score is found and the alignment traced back through the matrix using the cell directions:
| G | A | C | A | A | T | |
| G | 2 | -1 | -3 | -3 | -3 | -3 |
| G | 2 | -1 | -4 | -6 | -6 | -6 |
| C | -1 | -1 | 1 | -2 | -5 | -8 |
| A | -3 | 1 | -4 | 3 | 0 | -3 |
| T | -3 | -2 | -2 | 0 | 0 | 2 |
Table 3: Sequence alignment identified by tracing back through the scoring matrix.
And the resulting alignment:
     Subject         1  GGCA

                        | ||

     Query           1  GACA
Converting the resulting numeric matrix into pixels is relatively easy - normalize their values relative to the minimum and maximum values and set the pixel value based upon the result. Below are two such images created from aligning DNA sequences.
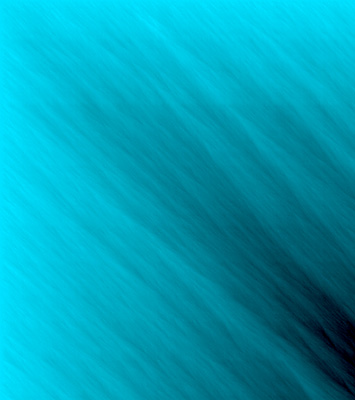
Sequence Alignment of two Disparate sequences.
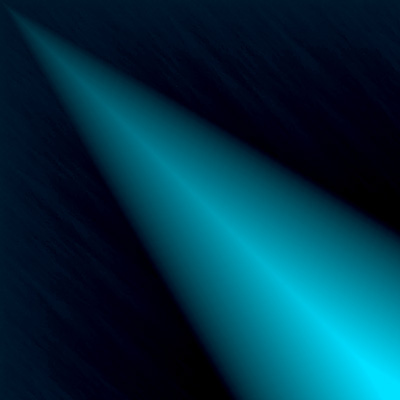
Sequence Alignment of two identical sequences.
There are no comments on this article.